No place to hide: How satellites expose environmental damage
- Satellite Evolution Group

- Jun 11
- 4 min read
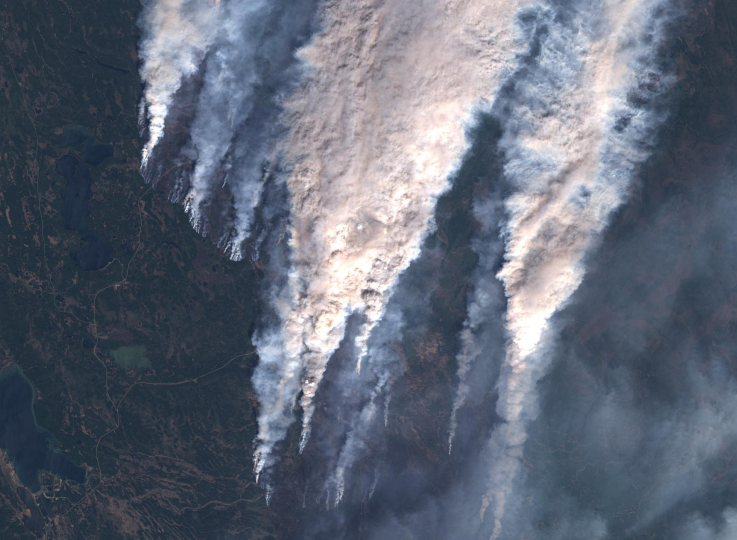
Environmental crimes thrive on a calculation: if a disaster happens deep enough in the jungle or far out at sea, no one can prove it. Illegal operators exploit this isolation, knowing that local communities and journalists lack the millions of dollars needed for helicopter surveys or dangerous ground expeditions. But satellite imagery offers an alternative. Whether the task calls for long-term archive analysis or fresh satellite tasking with 0.3 m resolution, vulnerable communities now have something to show in court.
by Kateryna Sergieieva, EOS Data Analytics
Exposing The Fake Plantations Hiding Deforestation In Pahang
On paper, the agricultural project in Pahang, Malaysia, appeared to be a legal plan to cultivate oil palm. However, local journalist Choon Chyuan Low suspected the operations were a front for environmental laundering — clearing pristine jungle just to sell timber. Residents of Kampung Tanah Pindah watched their ancestral lands disappear, but had no way to challenge state-backed developers.
Supported by the Pulitzer Center, Low turned to EOS Data Analytics (EOSDA) for evidence. EOSDA analyzed historical and current high-resolution satellite data to map the exact footprint of the logging operations. This analysis revealed that vast jungle tracts were stripped bare of valuable timber, and the promised oil palm trees were never actually planted.
Low’s comprehensive report was published on Malaysiakini, a major local media outlet. While it cannot change the situation overnight, it draws public attention to the issue, which is necessary to eventually raise environmental compliance.
Uncovering The Brazilian Amazon’s Illegal Gold Mines From Space
By 2022, illegal mining inside Brazil’s Munduruku Indigenous Reserve had expanded by over 363% in just two years. Miners did not just strip the rainforest; they also used mercury to extract gold. This chemical poisoned the Tapajós River, causing widespread neurological damage among the population. Some institutions were studying the issue on the ground, but proving the scale of these lawless operations required a view from above.
So, EOSDA used high-quality historical satellite images to assess 1,900 hectares of this remote territory. Researchers applied the NDVI (Normalized Difference Vegetation Index) to measure vegetation density between 2017 and 2022. The resulting maps showed bright red patches of bare soil, exposing a brand-new mining site and clandestine roads cut into the reserve.

This provided international human rights bodies with undeniable, measurable proof of the environmental crime. Still, the report by EOSDA is only the beginning of a longer effort. It draws global attention to the crisis, which is necessary to eventually raise environmental standards and force compliance across the region.
Documenting Ecuadorian Amazon Pipeline Failures Through Satellite Imagery
In April 2020, a landslide in Ecuador ruptured three major pipelines, sending crude oil down the Coca and Napo rivers. The toxic spill cut through three national parks and reached into Peru, cutting off drinking water and fishing grounds for local indigenous communities. Less than two years later, a second pipeline collapse turned the rivers black again.
Because of frequent landslides and earthquakes, pipeline collapses in Ecuador tend to become a chronic problem. However, tracking the total damage across hundreds of kilometers of remote rainforest was beyond the capacity of any ground team.
To look where ground teams couldn’t, EOSDA analyzed high-resolution satellite images around the San Rafael waterfall. The team assessed forest health and, based on that assessment, mapped where the leaking oil had spread. With independent facts, instead of endless arguments with oil companies, local communities finally had an objective record of the damage.
Providing Courtroom Proof To Stop Illegal Logging In Suriname
The Saamaka people have held territorial rights to their Surinamese rainforest lands since a 1762 treaty. Despite a 2007 international court ruling reaffirming these boundaries, illegal logging crews invaded the territory in January 2023, cutting secret roads and clearing thousands of trees. The Saamaka people need clear proof of the damage for lawsuits and public disclosure, especially to claim compensation for the lost carbon sinks.

To support this legal effort, EOS Data Analytics used high-quality satellite images and documented the ongoing forest degradation. Researchers found that the logging damage grew from 71.704 hectares in 2021 by an additional 376.385 hectares over the next two years. Armed with this evidence for court proceedings and building public awareness, the Saamaka hope to not only stop the logging but also protect their traditional way of life for future generations.
Tracking Sinking Land On America’s Tangier Island
Tangier Island in the Chesapeake Bay has lost two-thirds of its landmass since 1850. While local fishermen blame shoreline erosion and ask for a seawall, scientists point to land sinking by 2 millimeters a year and rising seas driven by global carbon emissions. Within a few decades, Tangier Island could become completely uninhabitable.
To clarify what is actually happening, EOSDA analyzed 24 years of historical satellite imagery. This analysis can help locals pinpoint where to reinforce the coastline and contribute to preserving their home.
Hard Evidence Where Ground Tracking Fails
Victims of remote pipeline spills or illegal logging rarely have the resources to document the crimes against them. Instead of expensive helicopter surveys or risky jungle expeditions, local communities can use medium or high-resolution Earth images to track the damage. Satellites pin down the exact location and timeline of the destruction, so that the violators can’t deny it.
Author :
Kateryna Sergieieva
Kateryna Sergieieva has a Ph.D. in information technologies and 15 years of experience in remote sensing. She is a scientist responsible for developing technologies for satellite monitoring and surface feature change detection. Kateryna is an author of over 60 scientific publications.


